
Measure your site first with Lighthouse or PageSpeed Insights, then fix the highest-impact issues, images, caching, and render-blocking JavaScript, before touching anything server-side. Apply quick wins in hours, tackle code and hosting problems next, and confirm every change against Core Web Vitals with real-user monitoring. That order matters more than any individual fix.
TL;DR:
- Fix image issues first by resizing, compressing, and using WebP or AVIF formats, as they offer the quickest and most impactful speed gains.
- Prioritize eliminating render-blocking CSS and JavaScript with critical CSS, deferred scripts, and request minification to improve perceived load time.
- Ensure server response times stay below 200 milliseconds by using a CDN, proper host, and enabling HTTP/2 or HTTP/3 for faster secure connections.
- Regularly monitor real-user metrics like LCP, INP, and CLS via RUM to verify that speed improvements positively impact actual visitor experiences.
- Avoid relying solely on AMP for mobile speed; instead, optimize responsive design, images, and caching to deliver fast mobile experiences without added maintenance.
Table of Contents
- How Do You Test and Measure Website Speed?
- Quick Wins That Speed Up a Website in Hours
- What Front-End Fixes Actually Reduce Render Blocking?
- Does Hosting and CDN Choice Affect Page Speed?
- How Do You Prioritize Speed Fixes Without Breaking the Site?
- How Do You Verify Speed Improvements Actually Worked?
- Why Does Database Cleanup Matter for Page Speed?
- Should You Use AMP for Mobile Speed?
- How EPD Websites Approaches Speed for Professional Sites
- Why Speed Fixes Fail on Professional-Service Sites
- Get a Managed Speed Audit From EPD Websites
- Sources
How Do You Test and Measure Website Speed?
Google's PageSpeed Insights and Lighthouse give you a lab score in seconds. WebPageTest goes deeper, showing a waterfall of every request so you can see exactly what's blocking rendering and in what order resources load. Both matter, but they answer different questions, and skipping one leaves a blind spot.
Lab tools test under controlled conditions. Real-user monitoring (RUM) captures what actually happens on the devices and networks your visitors use, which is why user-centric metrics like Largest Contentful Paint, Interaction to Next Paint, and Cumulative Layout Shift matter more than a perfect lab score.
Here's what each metric tells you:
- LCP (Largest Contentful Paint): how long until the biggest visible element, usually a hero image or headline, finishes rendering
- INP (Interaction to Next Paint): how quickly the page responds when someone clicks or taps
- CLS (Cumulative Layout Shift): whether elements jump around as the page loads
- TTFB (Time to First Byte): how fast your server starts sending data at all
Test on both mobile and desktop, from more than one geographic location if your audience is spread out, and save a dated baseline report before you change anything. Without that snapshot, you're guessing at whether a fix actually worked.
Quick Wins That Speed Up a Website in Hours
Images are usually the biggest offender on a page, often accounting for more bytes than everything else combined, which makes them the fastest place to see real gains. Work through these in order:
- Resize and compress images before upload; a 3,000 pixel wide photo displayed at 800 pixels is pure waste.
- Switch to WebP or AVIF for anything that doesn't need to be a PNG, cutting file size substantially with no visible quality loss.
- Lazy-load offscreen images and video so the browser only fetches what's actually in view.
- Set long cache-control headers on static assets like logos, CSS, and JavaScript files so returning visitors don't re-download them.
- Enable gzip or brotli compression on your server; it shrinks text-based files (HTML, CSS, JS) before they travel over the network.
- Audit redirects and dead plugins. Every redirect adds a round trip, and abandoned plugins often load scripts nobody uses anymore.
If you run WordPress, tools like Jetpack Boost automate several of these steps at once, generating Critical CSS and deferring scripts without touching code. It's a reasonable shortcut, though it still needs testing on staging since automated fixes occasionally clash with a theme's custom styling.
Pro Tip: Fix images first, always. It's the one category where a single afternoon of work can shave a full second or more off load time, and it requires zero coding.
Most sites also carry an image CDN option through their host already. If yours doesn't, that's worth flagging before you invest time elsewhere.
What Front-End Fixes Actually Reduce Render Blocking?
Browsers stall when they hit CSS or JavaScript files before they can paint anything on screen. Critical CSS solves this by inlining just the styles needed for the visible portion of the page, letting the rest load afterward without delaying what the visitor sees first.
Non-critical JavaScript should load with defer or async attributes so it doesn't block rendering while the browser waits for it to download. Minifying and combining CSS, JavaScript, and HTML also cuts the number of requests and shrinks total payload, which compounds with the compression steps above.
A few more levers worth checking:
- Audit every third-party script (chat widgets, analytics, ad tags) and remove anything that isn't earning its keep
- Serve assets over HTTP/2 or HTTP/3, which most modern hosts already support
- Subset your web fonts to only the characters you actually use, preload the primary font file, and set
font-display: swapso text isn't invisible while fonts load
Pro Tip: Font loading is an underrated cause of layout shift. If your headline font swaps in late and the text reflows, that's a CLS penalty you can fix in one line of CSS.
Does Hosting and CDN Choice Affect Page Speed?
Time to First Byte reflects how fast your server responds before the browser even starts downloading page content. A TTFB under roughly 200 milliseconds is a reasonable target; anything well above that usually points to underpowered hosting, an unoptimized database, or a server sitting too far from your visitors.
A few infrastructure moves tend to deliver outsized returns:
- Move static assets (images, CSS, JS) onto a CDN so they're served from a location near the visitor instead of your origin server
- Use origin shielding or reverse-proxy caching for dynamic pages that don't change on every request
- Choose a fast, reliable DNS provider, since slow DNS resolution adds delay before anything else even starts
- Confirm TLS 1.3 and HTTP/2 or HTTP/3 are enabled, both of which speed up secure connections
Combining backend fixes like these with the front-end work above tends to produce the most durable gains, rather than either one alone.
How Do You Prioritize Speed Fixes Without Breaking the Site?
Score every issue by expected impact on LCP, INP, or CLS against the effort to fix it. High-impact, low-effort items (image compression, cache headers) go first; low-impact, high-effort items (a full framework migration) go last or get dropped entirely.
- Rank fixes by impact versus effort, and tackle the top-left quadrant first.
- Test on staging, not production, especially for anything touching CSS or JavaScript loading order.
- Roll out during low-traffic windows and use feature flags if your platform supports them, so you can revert quickly.
- Document each change in a short changelog so stakeholders know what shipped and when, which also makes it easier to trace a regression back to its cause.
If your team lacks the bandwidth or the technical depth for steps like Critical CSS generation or server tuning, that's usually the point to bring in a managed provider rather than losing weeks to trial and error.
How Do You Verify Speed Improvements Actually Worked?
Re-run your lab test after every meaningful change and compare the new waterfall against your baseline. Look specifically at whether LCP, INP, and CLS moved in the right direction, not just whether the overall score went up, since a higher score can mask a metric that got worse.
- Set up RUM so you're tracking Core Web Vitals from real visitors, not just lab conditions
- Configure alerts that flag a regression the moment it happens, rather than discovering it weeks later in a traffic report
- Use WebPageTest's scripting feature to run repeatable regression checks after each deployment
- Keep a performance history log so you can correlate a slowdown with a specific code push or plugin update
Lab scores and field data can diverge. A Cloudflare-documented pattern shows that real-user metrics sometimes tell a different story than a perfect Lighthouse run, which is exactly why RUM has to be part of the ongoing process, not a one-time check.
Why Does Database Cleanup Matter for Page Speed?
Every dynamic page, whether it's a blog, a CMS-driven site, or a client portal, pulls data from a database before it can render anything. A bloated database with years of unused revisions, spam comments, orphaned metadata, and abandoned plugin tables slows that query down, which shows up directly in your TTFB.

The fix is routine housekeeping rather than a one-time overhaul. Clean out post revisions and trashed content on a schedule, remove tables left behind by uninstalled plugins, and add indexes to the columns your site queries most often, typically anything tied to search, filtering, or category pages. Query caching helps too: many hosting platforms offer object caching (Redis or Memcached) that stores the results of expensive database queries so the server doesn't rerun them on every visit.
For a law firm or CPA site running a handful of practice-area pages and a blog, website optimization for maximum leads rarely feels dramatic day to day. It shows up gradually, as pages that used to load quickly start dragging by a few hundred milliseconds, and by the time it's noticeable, months of unpruned data have accumulated. A quarterly cleanup, or a managed host that handles it automatically, prevents that slow drift entirely.
Should You Use AMP for Mobile Speed?
Accelerated Mobile Pages, a stripped-down HTML framework Google introduced years ago, was built to make mobile pages load near-instantly by restricting JavaScript and enforcing strict markup rules. It worked, but the tradeoffs have made it a shrinking option rather than a growing one.
AMP requires maintaining a separate, simplified version of every page, which adds real ongoing overhead for a small team. It also limits design flexibility in ways that matter for professional-service sites where visual polish reinforces credibility, a law firm or medical practice site that looks stripped down can undercut the very trust it's trying to build. Google no longer gives AMP pages preferential treatment in mobile search results the way it once did, which removed the strongest reason to adopt it in the first place.
For most professional-service websites today, a well-optimized responsive site, following the image, caching, and Critical CSS practices covered earlier, delivers comparable mobile speed without the maintenance burden of a parallel AMP codebase. AMP still makes sense for high-volume publishers running mostly static article pages, but it's rarely the right call for a firm's core marketing site.
How EPD Websites Approaches Speed for Professional Sites
Every EPD Websites project follows the same sequence: audit first, prioritize by impact, implement, then monitor. For a law firm or CPA site, that usually means catching the same culprits covered above, an oversized hero image, an unoptimized page-builder framework, before they hurt conversions.
Most fixes land within days, not weeks, because design and hosting sit under one provider, which cuts the back-and-forth that happens when a design agency and a separate host each blame the other for a regression. The portfolio shows how that plays out across real professional-service builds.
Why Speed Fixes Fail on Professional-Service Sites
Most speed advice online is written for e-commerce sites moving thousands of SKUs, and it doesn't translate cleanly to a five-page law firm site or a CPA's marketing page. The problem isn't the fixes themselves. It's that professional-service sites are usually built on page-builder platforms chosen for visual flexibility, and those platforms load a mountain of unused CSS and JavaScript by default, regardless of how small the actual content is.
I'd argue the bigger failure point isn't technical at all. It's that firms treat a speed fix as a one-time project instead of a standing practice. Someone compresses the images, feels good about the Lighthouse score, and never checks again. Six months later a new hero video got added, a booking widget script got dropped in, and TTFB crept back up, and nobody noticed because nobody was watching real-user data.
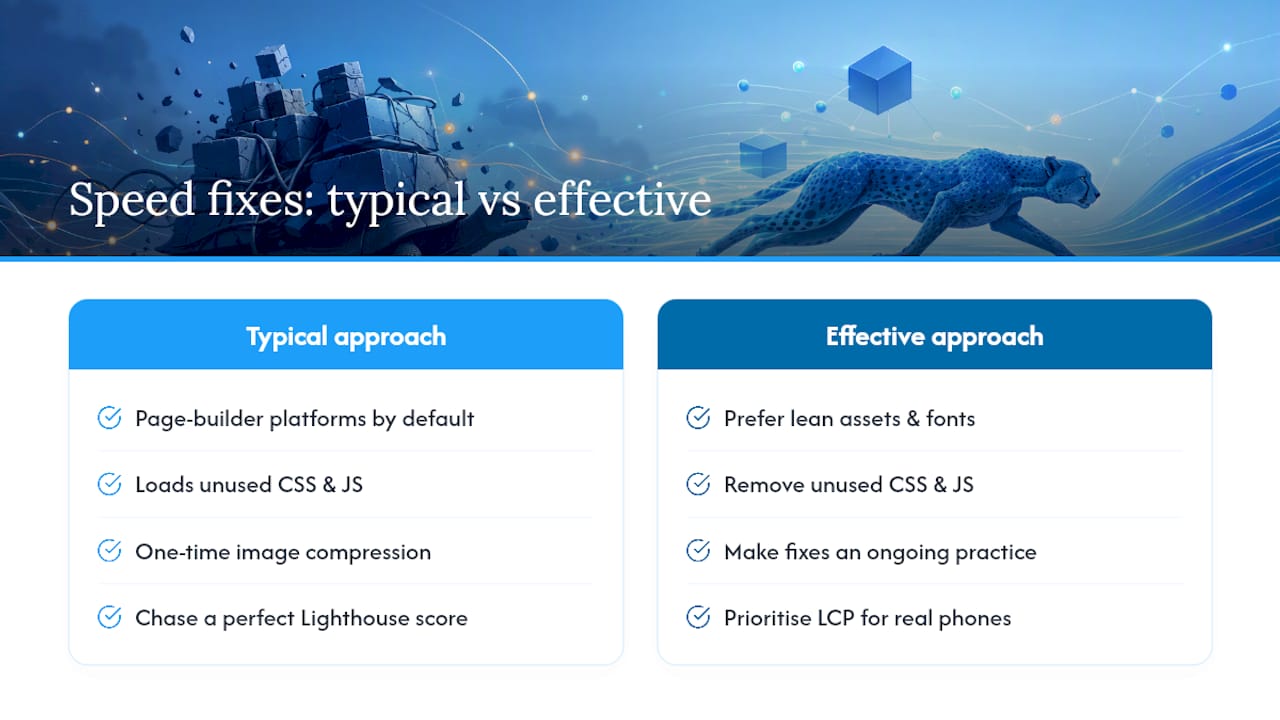
The Cloudflare finding that oversized hero images and heavy frameworks are the most common cause of poor LCP on exactly this type of site isn't a coincidence. Attorneys and consultants want a site that looks premium, and premium too often gets translated into "big image, custom font, animated everything," which is the opposite of fast. The firms that get this right aren't the ones with the fanciest fix. They're the ones who treat monitoring as part of the site's ongoing maintenance, the same way they'd treat a malpractice policy: not exciting, but the thing you're glad exists when something breaks.
If there's one piece of contrarian advice worth taking from this, it's to stop chasing a perfect 100 score and start chasing the version of your site that shows the headline and hero image fastest for a real visitor on a real phone. That's the number that actually affects whether a prospective client stays on the page or leaves.
— Kate
Get a Managed Speed Audit From EPD Websites
Fixing speed issues yourself takes time most attorneys, CPAs, and consultants don't have between billable hours and client work. Epdwebsites offers a straightforward alternative: a performance audit that identifies exactly what's slowing your site down, images, hosting, render-blocking scripts, without you having to learn WebPageTest waterfalls or database internals.

The audit comes back with a prioritized list of fixes, an honest look at whether your current hosting is holding you back, and a clear estimate of what it takes to resolve each issue. Because Epdwebsites handles design, hosting, and performance monitoring under one roof, fixes get implemented and verified without the finger-pointing that happens when a separate host and design firm each blame the other for a slowdown.
If you have the technical staff and the hours to spare, doing it yourself with the steps above is entirely workable. If you'd rather hand it to someone who does this daily for law firms, CPA offices, and medical practices, start with a look at the portfolio and reach out for an audit.